Minority-owned businesses strengthen local economies and communities. They diversify choice and opportunity and challenge industry norms. And the visibility of businesses run by black, indigenous, and other people of color (BIPOC) both celebrates and perpetuates BIPOC achievement.
In America, BIPOC businesses are knocking it out of the park. Black women are starting more businesses than white men or women right now. And white male business owners are now outnumbered by women owners (of which 35% are women of color) and men of color.
But the gaps between the white and BIPOC economies remain profound. A McKinsey survey found that:
“15 percent of white Americans hold some business equity, [while] only 5 percent of Black Americans do. Among those with business equity, the average Black American’s business equity is worth about 50 percent of the average American’s and a third of the average white American’s.”
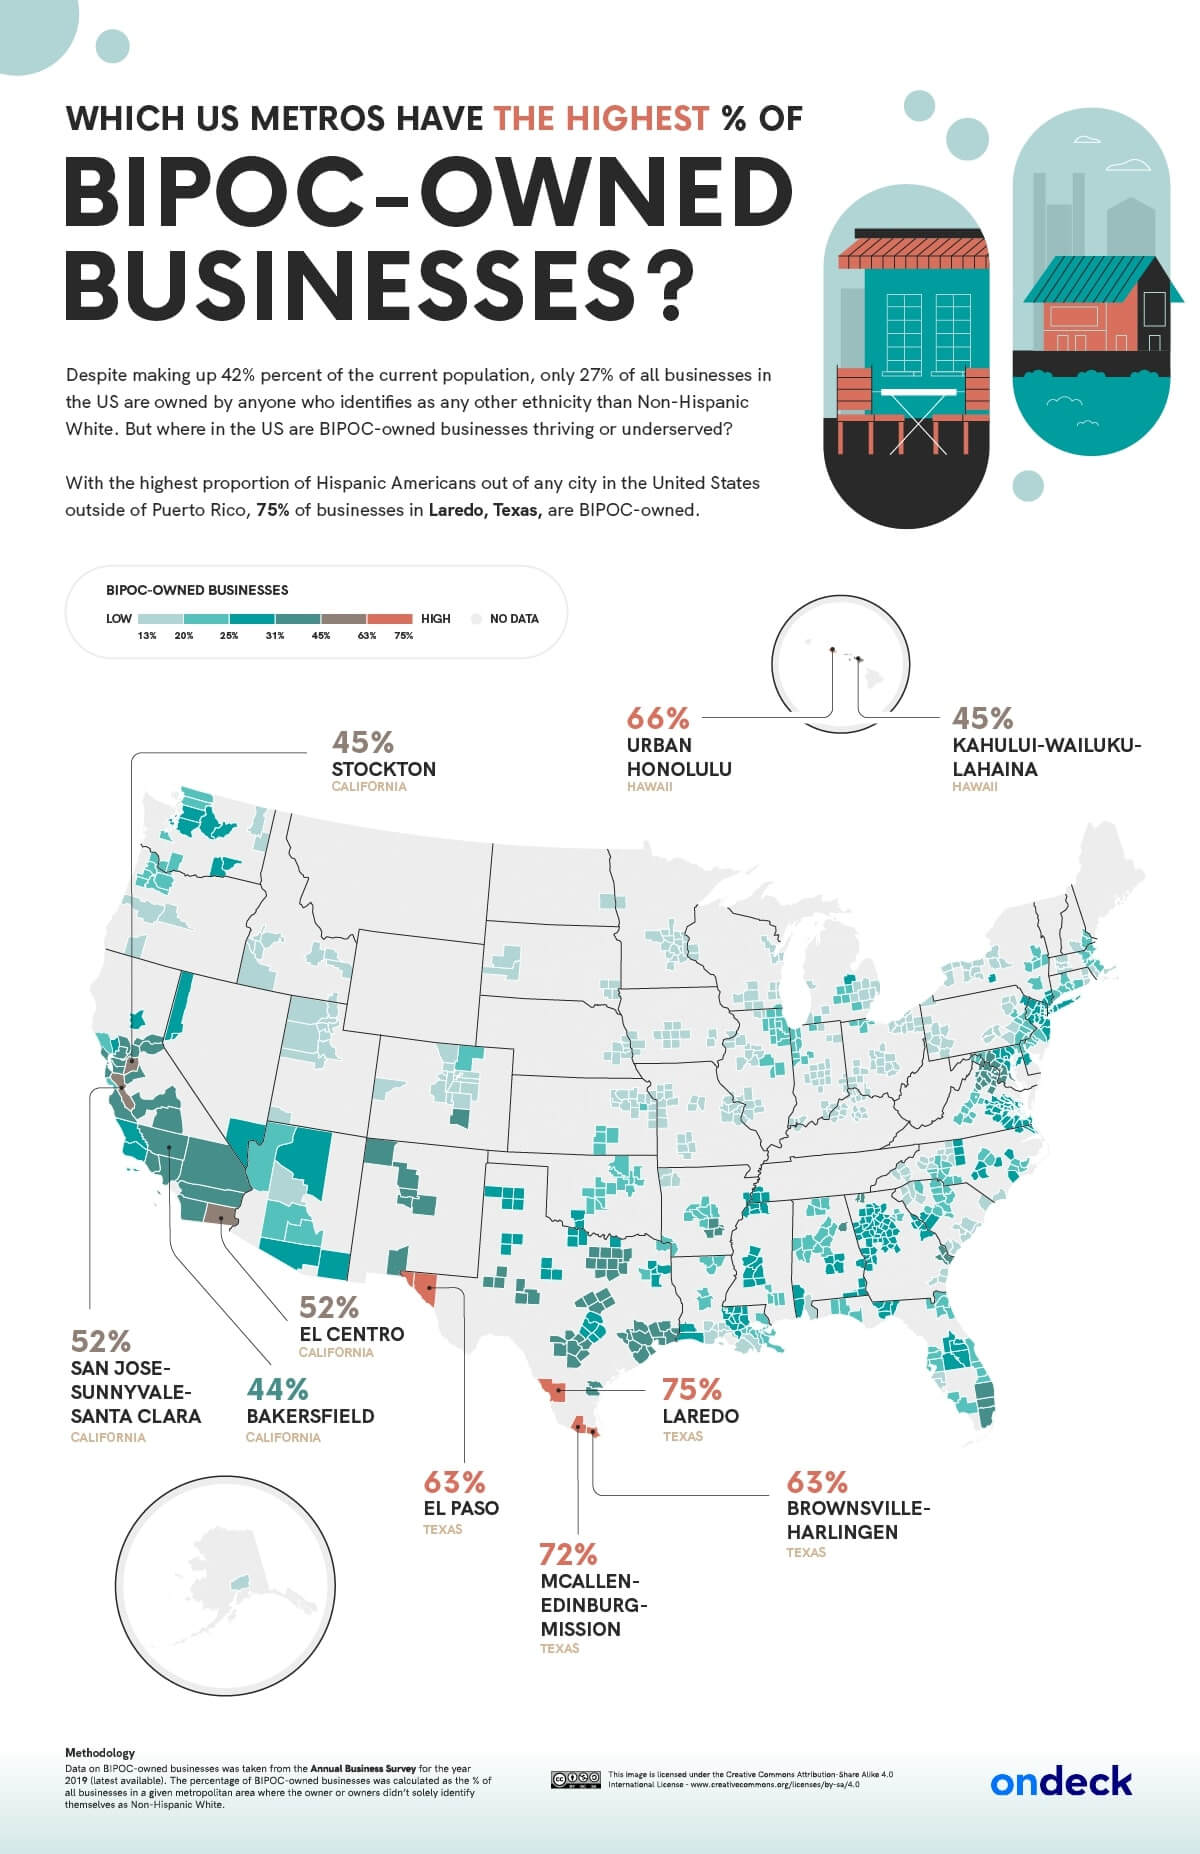
OnDeck has found that while 42% of the U.S. population are people of color, only 27% of businesses have BIPOC owners. Plus, in 82% of the metropolitan areas we analyzed, the proportion of BIPOC-owned businesses is lower than the proportion of the local BIPOC population.
We used the latest U.S. Business Census data to identify the areas across the U.S. with the biggest disparity between minority business owners and the minority population (where minority is defined as ‘the percentage of the total population that does not identify as non-Hispanic white.’) Here’s what we found.
Key Findings
- In 236 out of 287 (82%) of the metropolitan areas we analyzed, the share of BIPOC-owned businesses is lower than the share of the local population who are BIPOC.
- Detroit-Warren-Dearborn, MI, has the most underserved BIPOC population: the percentage of BIPOC in the population (36%) is 25 larger than the percentage of BIPOC-owned businesses (16%).
- Kingsport-Bristol-Bristol, TN-VA, has the best served BIPOC population, with an 8% BIPOC population served by 21% BIPOC business ownership.
- Laredo, TX, has the highest percentage of BIPOC businesses (75%); however Laredo also has the highest BIPOC population (96%), which is 28 times larger than the population share.
The Industries with the Highest and Lowest Proportion of BIPOC Ownership
Our next chart shows the proportion of businesses with BIPOC ownership across every major U.S. industry. The industry with the greatest proportion of BIPOC owners is Utilities, where more than half (54%) of American businesses are BIPOC-owned. The New York Times reported as far back as 1981 that “energy-related companies dominated the list of the top 100 black-owned businesses in revenues” – overtaking the prominence of car dealerships at the time.
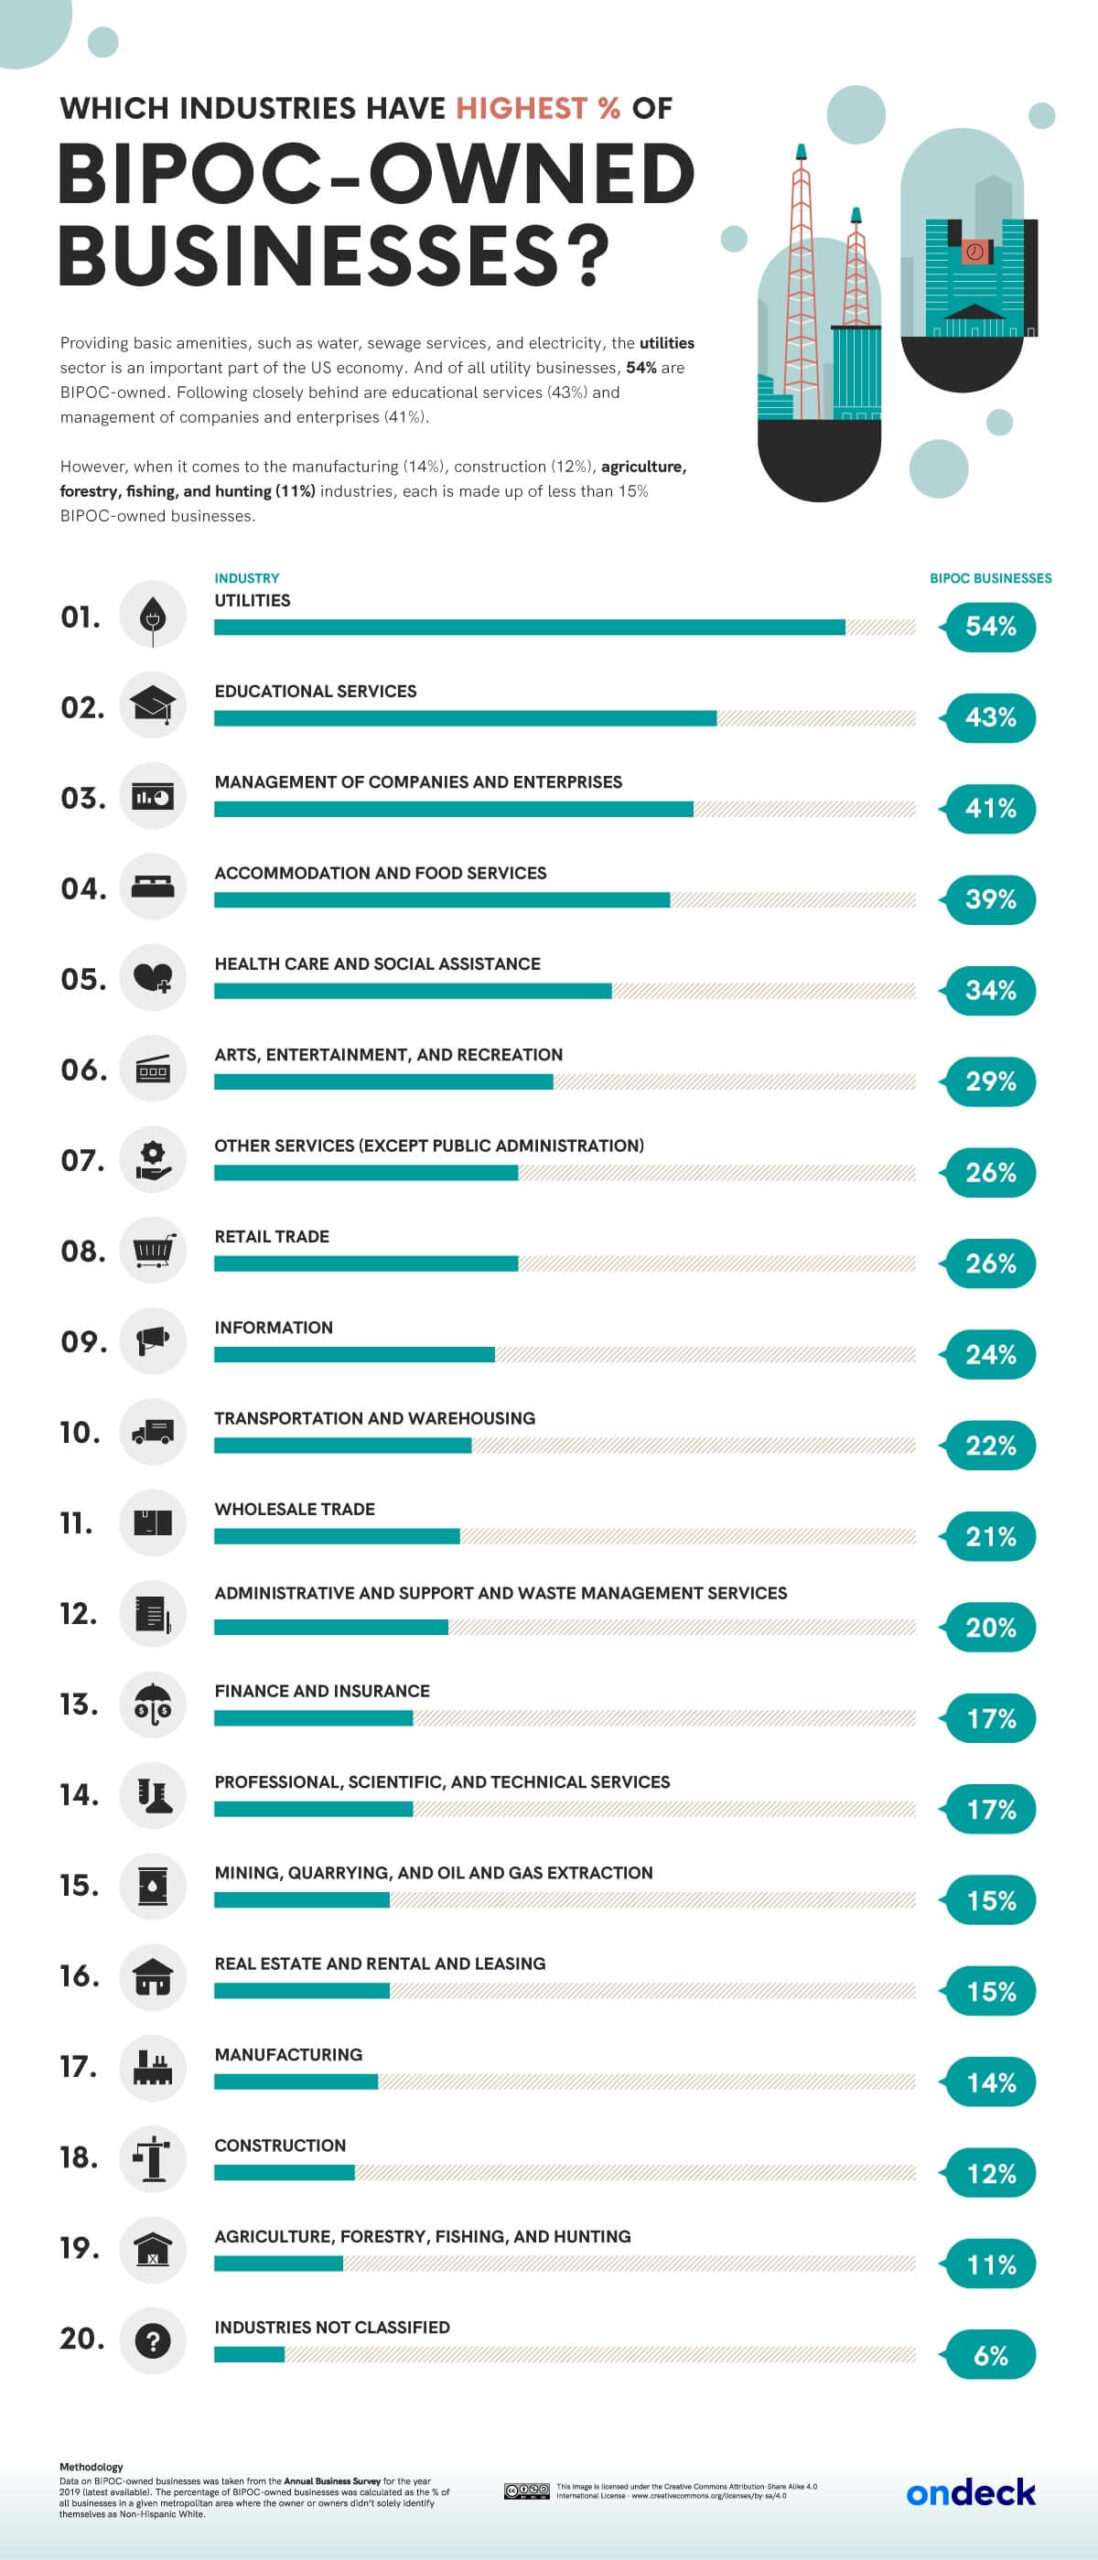
The industry with the lowest significant proportion of BIPOC owners is Agriculture, Forestry, Fishing, and Hunting. Just 2,854 (11%) of a total 23,220 businesses in this sector are BIPOC owned. This is an issue because “food and agriculture, like everything in this country, are deeply intertwined with our nation’s entrenched history of slavery and structural racism,” according to the College of Agricultural, Human, and Natural Resource Sciences at WSU. “Our food system actively silences, marginalizes, and disproportionately impacts people of color.”
The Representation Gap Between BIPOC Population and Business Ownership
Our next chart shows the percentage of BIPOC population and businesses in the ten most underserved metropolitan areas in the US. All ten have less than half the share of businesses in town compared to their share of the population. Detroit-Warren-Dearborn, MI, has the biggest disparity of all. The percentage of BIPOC in the population is 36%, which is 2.25 times larger than the percentage of BIPOC-owned businesses (16%).
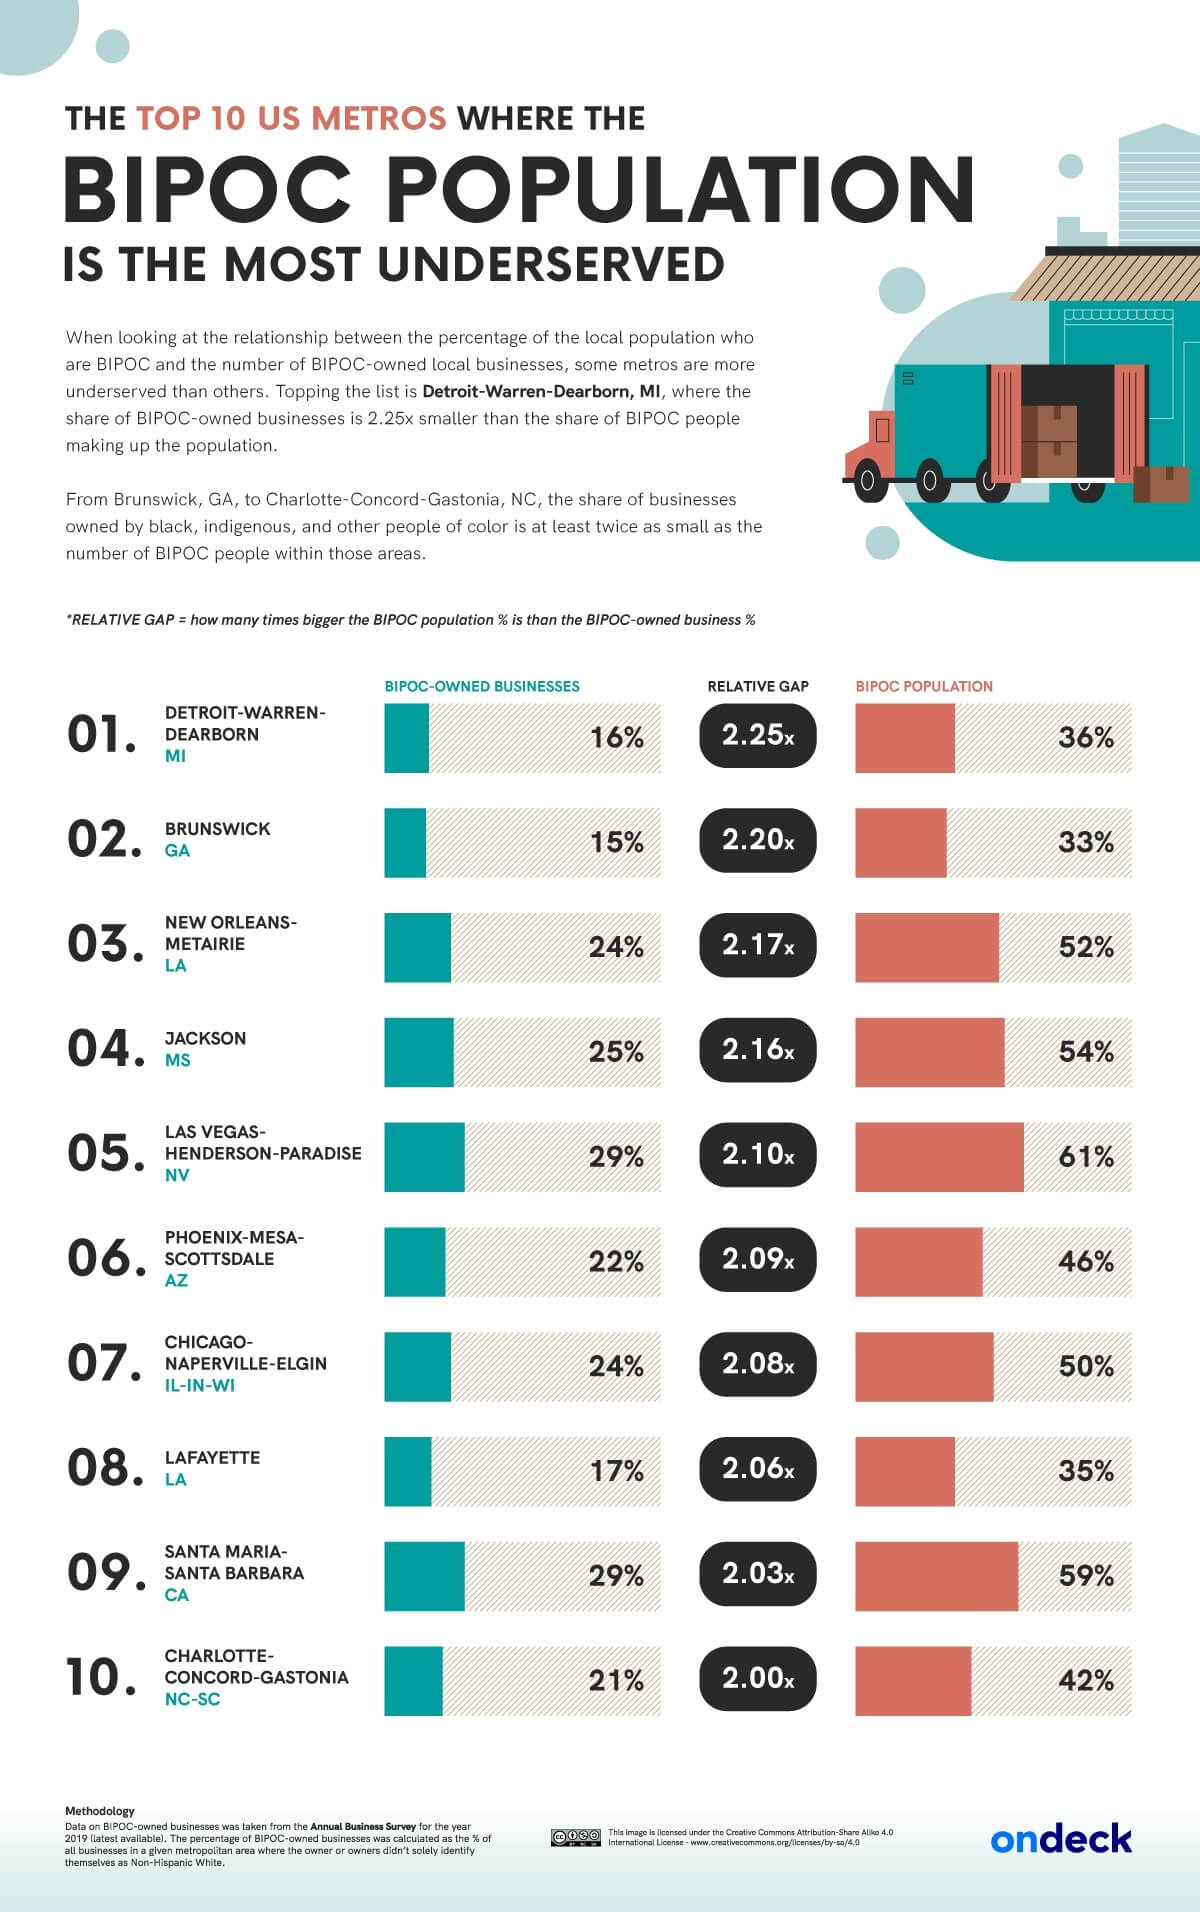
There are a handful of metropolitan areas with a smaller proportion of BIPOC-owned businesses. These include Rapid City (SD), Provo-Orem (UT), Bend-Redmond (OR), Logan (UT-ID), and Springfield (MO), where just 13% of businesses are owned by BIPOC entrepreneurs. However, these areas also have a smaller BIPOC population, so they are relatively better served than the areas in the chart.
Graph: Visualizing the BIPOC Population/Business Ownership Disparity
This graph visualizes the overall relationship between the number of BIPOC-owned businesses and BIPOC in the population. The red line shows ‘parity’ – districts on this line have an equal percentage of BIPOC residents and BIPOC-owned businesses. The green-blue line shows the general state of affairs in America. It demonstrates that, on average, most metropolitan areas have a significantly lower percentage of BIPOC businesses than BIPOC residents.
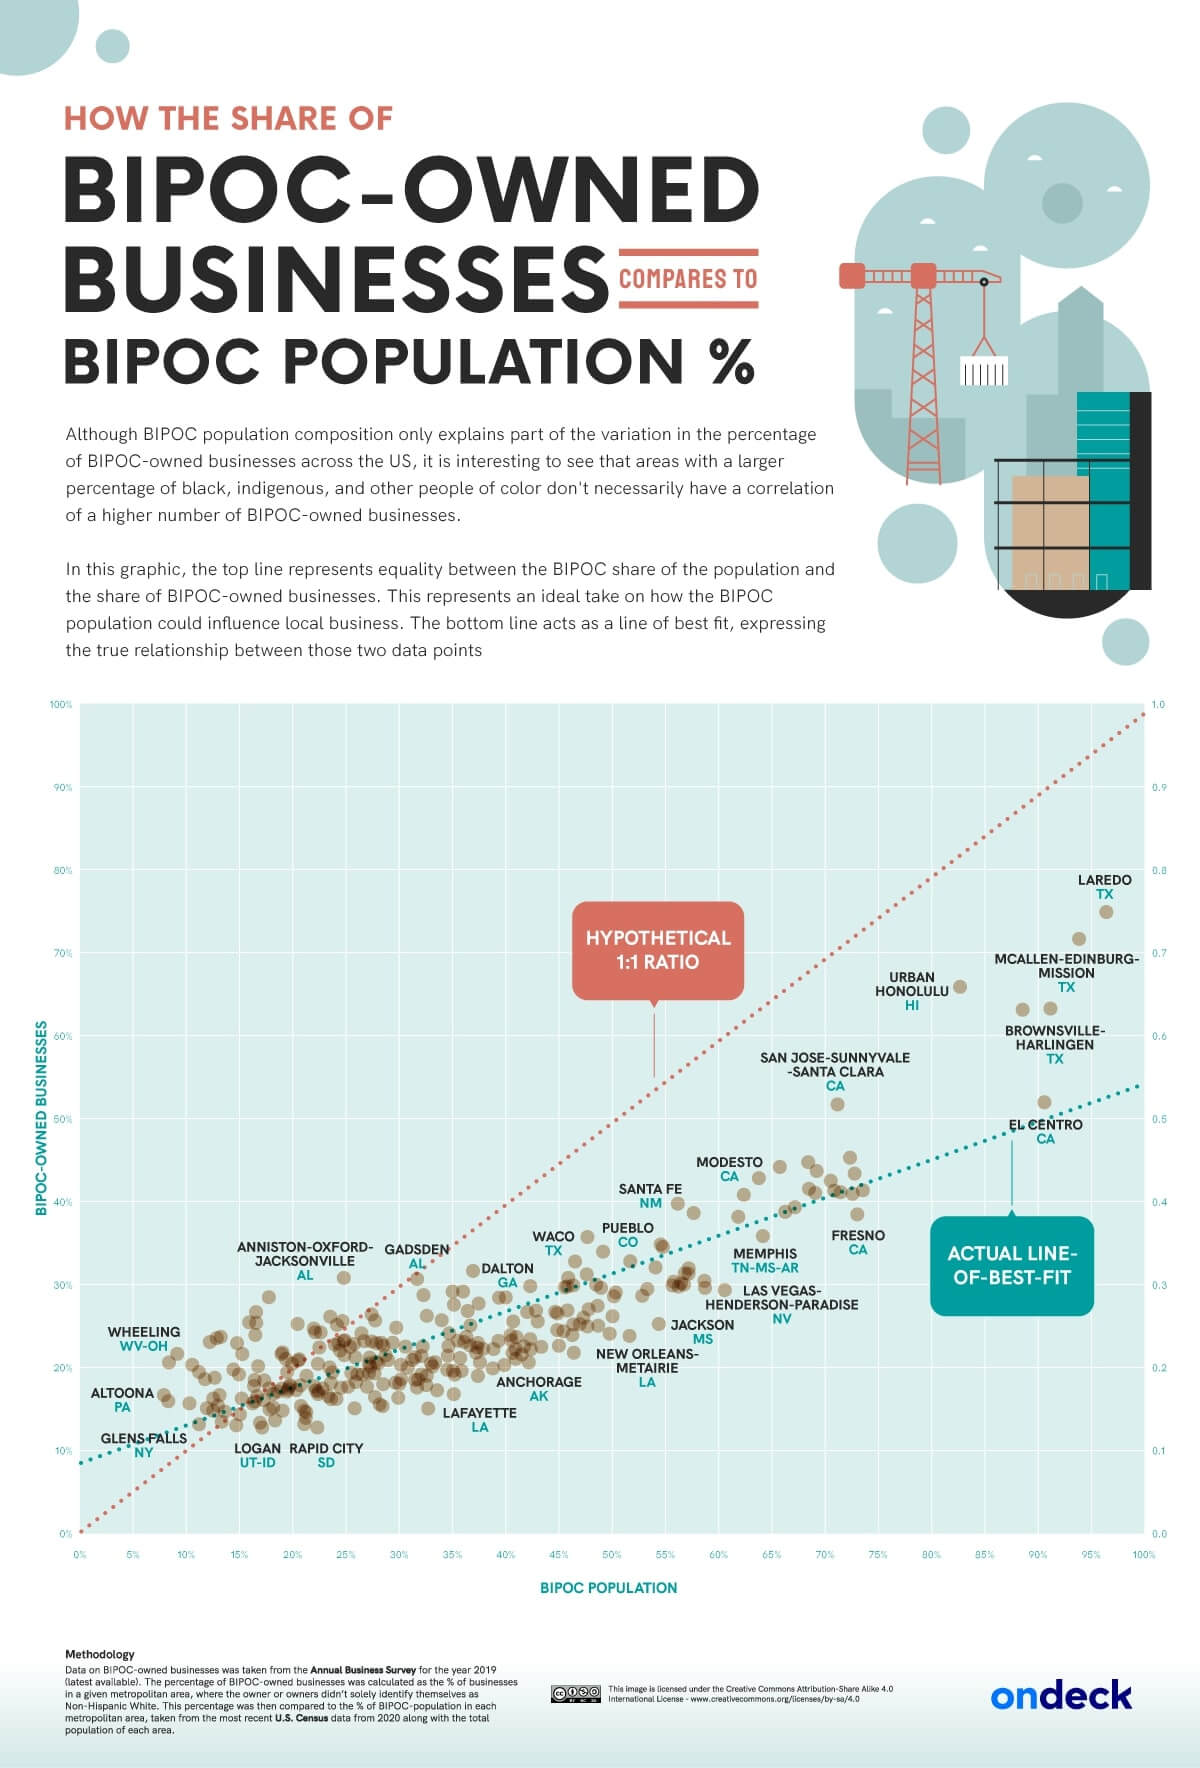
There is another pattern to observe. All the cities above the red line are at the lower end of the BIPOC population scale. In other words, cities with a large proportion of BIPOC residents struggle to reflect that number in BIPOC business ownership.
However, most of the cities below the blue-green line (those with the lowest representation in business) are also low-mid BIPOC population areas. The cities with the greatest proportion of BIPOC residents have BIPOC business ownership levels somewhere higher than the national trend but lower than 1:1 parity.
BIPOC Population vs. Business Ownership in America’s Biggest Metro Areas
The following chart filters our results to include only metropolitan areas with a population between one-ten million. The disproportion between BIPOC population and business ownership is particularly keen in America’s largest metro areas. Six of the overall top ten underserved metro areas, and nearly half of the top 40, have a population of over one million.
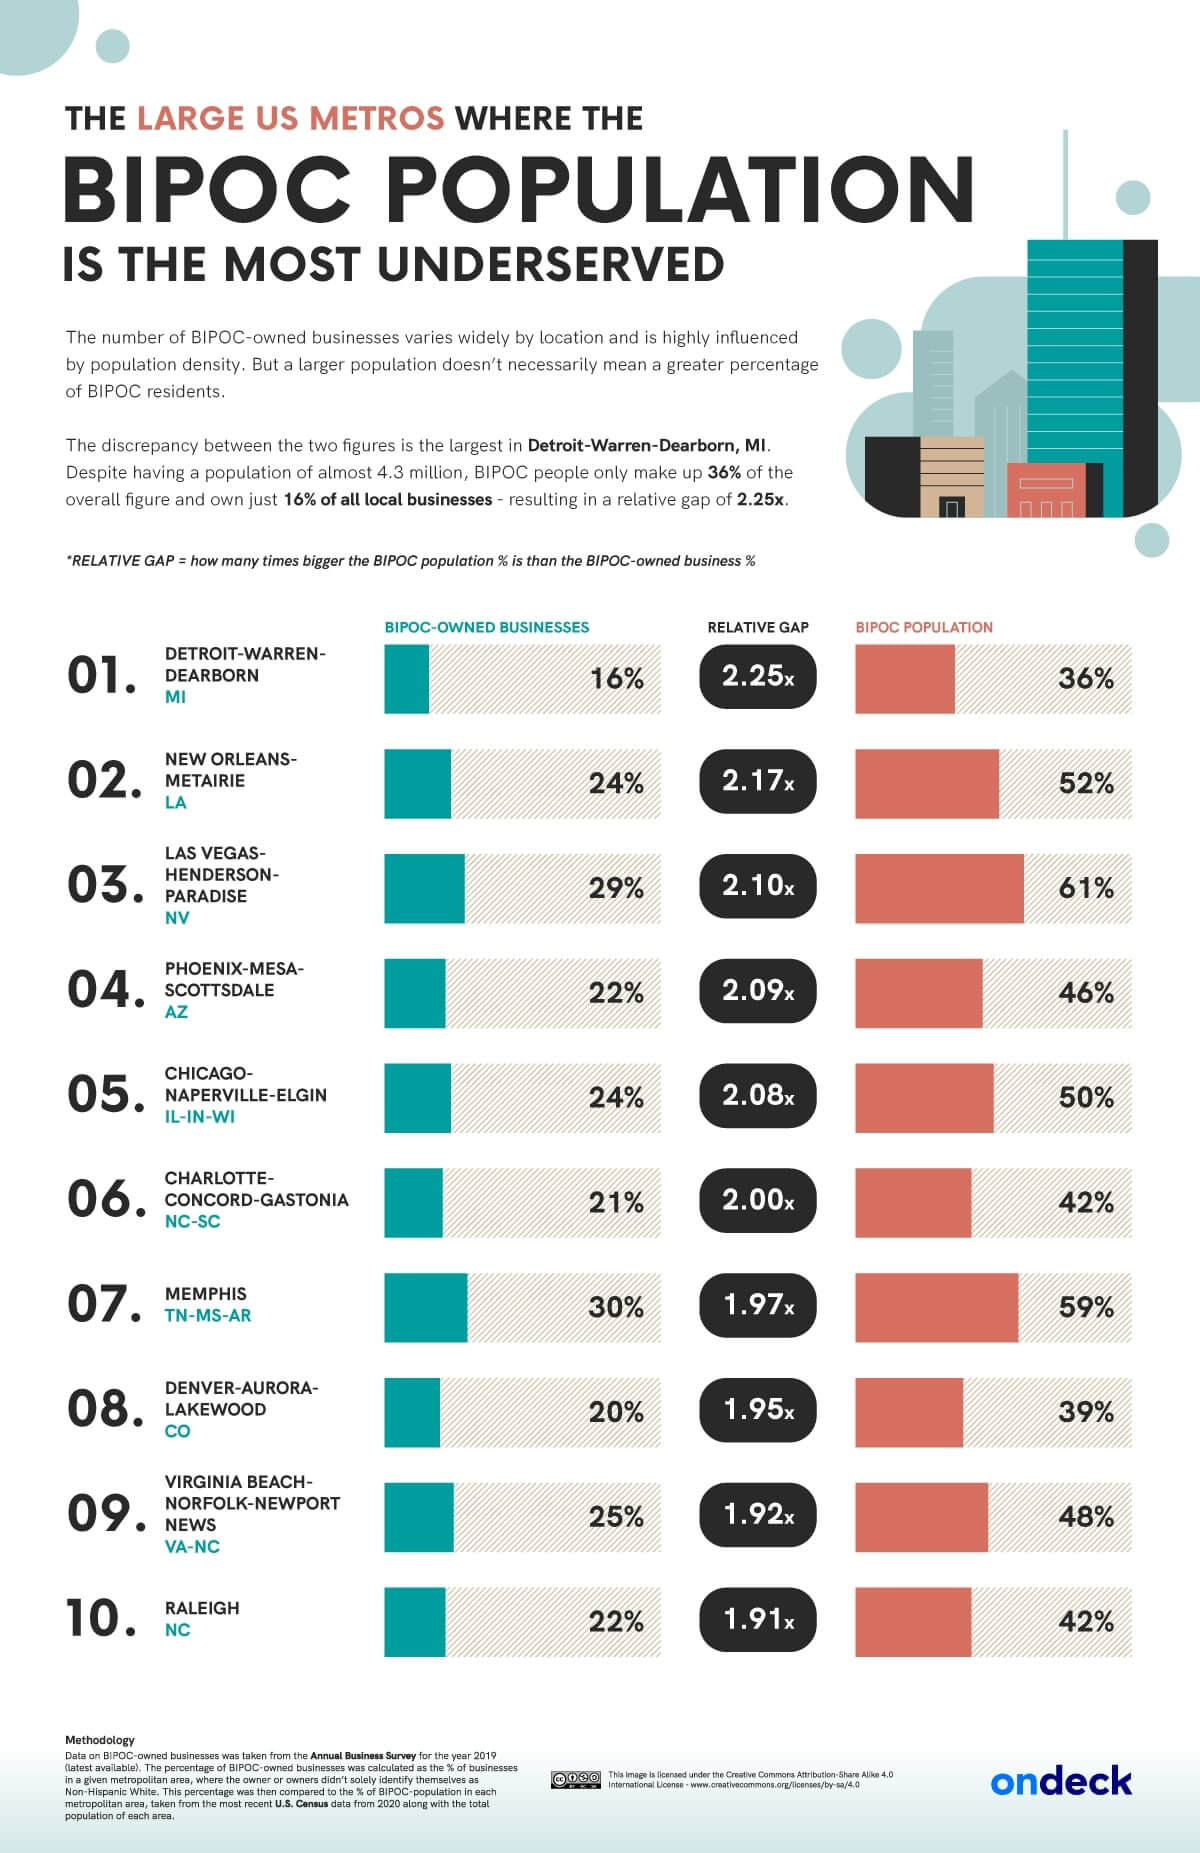
Additionally, we found no metropolitan areas at this scale with a zero or positive disproportion between population and ownership. Every single area with a population over one million has a greater share of BIPOC population than it does BIPOC business ownership.
How BIPOC Populations in Mid-Sized Metropolitan Areas Are Served by BIPOC Businesses
This time we filtered it down to mid-sized areas – those with a population of 500,000-1,000,000. Areas of this size tend to have a better proportion of BIPOC-owned businesses to BIPOC population compared to larger areas. Jackson, MS, is the only mid-sized area in our overall top ten of being underserved. However, it is very much possible to spend a day in Jackson only patronizing BIPOC businesses.
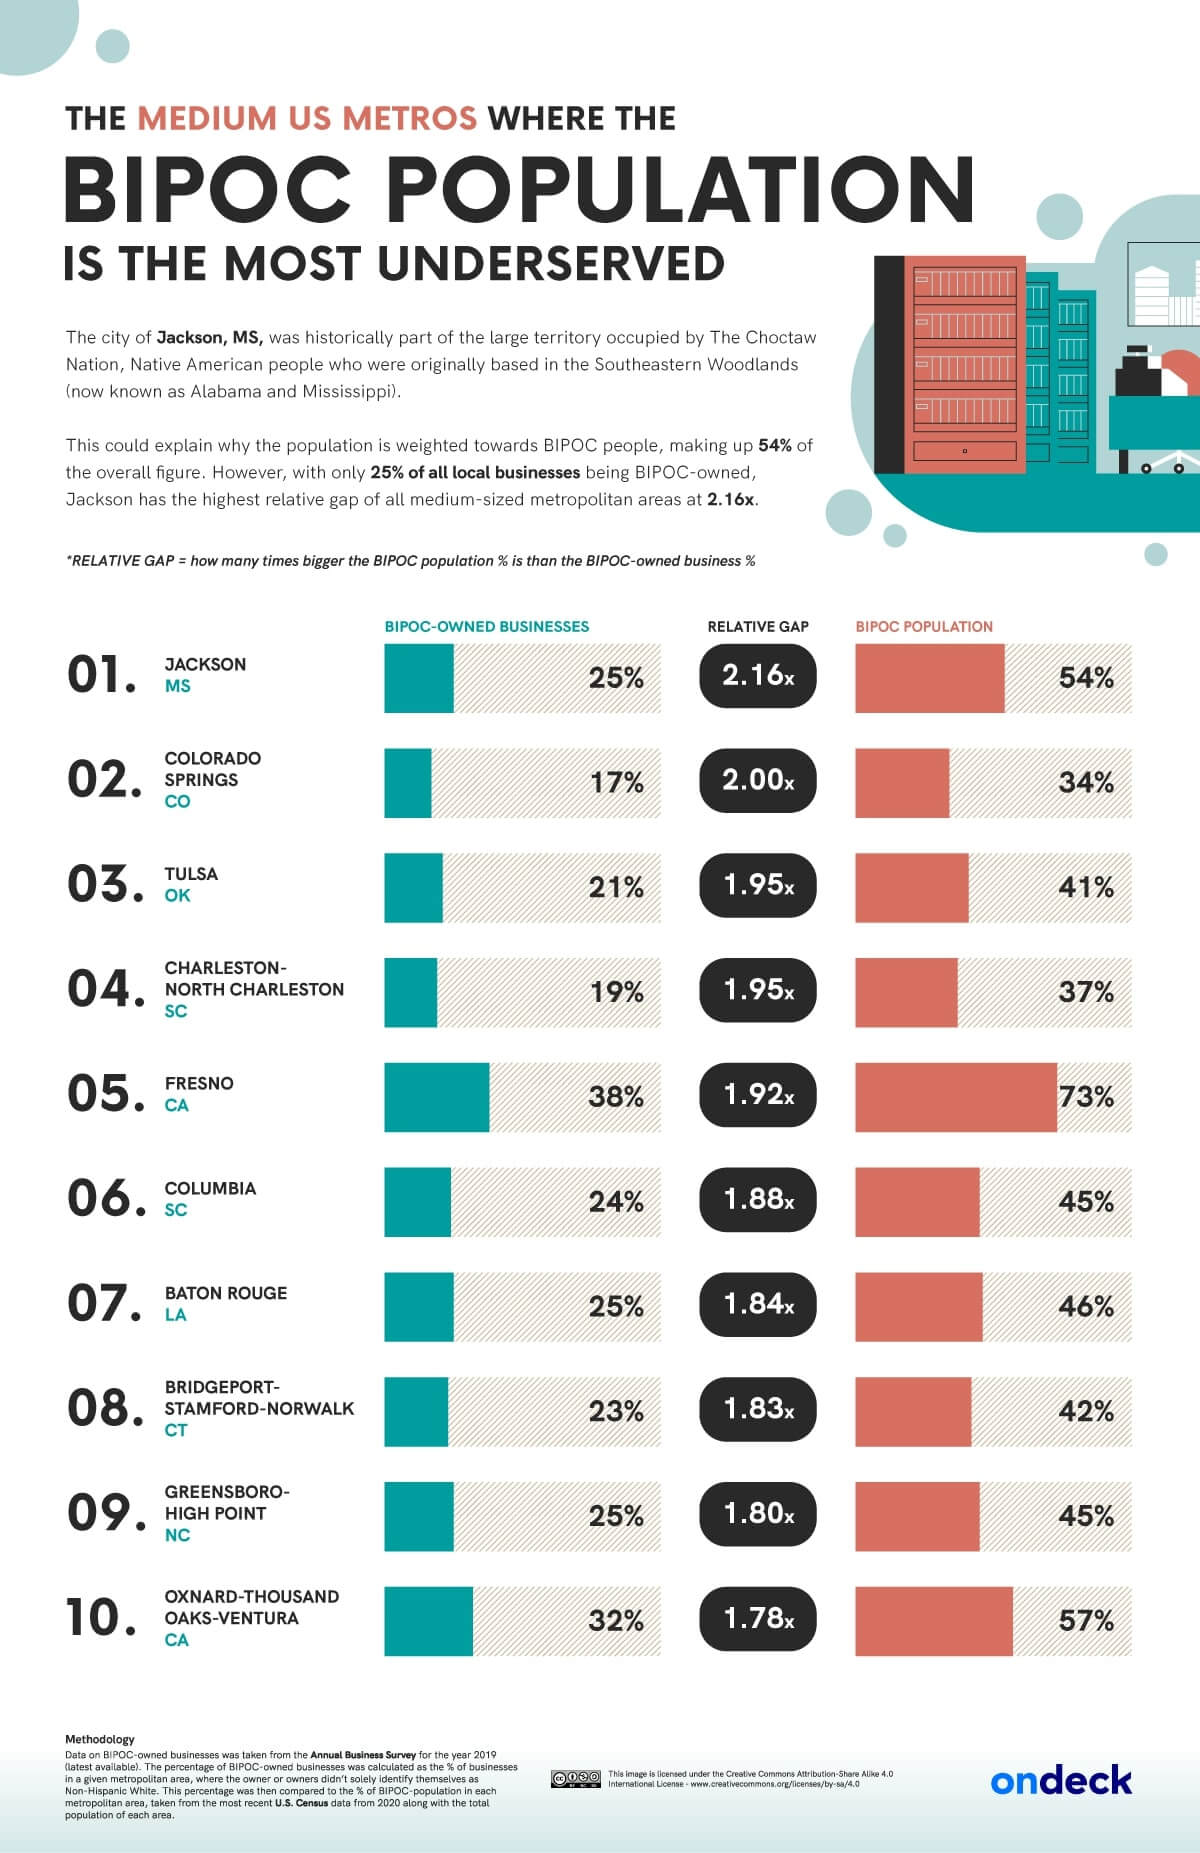
We did find two metropolitan areas of this size where the BIPOC population is ‘over-represented’ in business ownership: Portland-South Portland, ME, and Knoxville, TN. Only 17% of Knoxville’s 814,914 population is BIPOC, but 18% of the businesses are BIPOC owned. A mention goes to Chattanooga, TN-GA, too, where precisely one-quarter of the population and one-quarter of business ownership is BIPOC.
Small Areas Include Most ‘Positive’ BIPOC Business Ownership Disparity
Finally, here are the statistics for BIPOC population and business ownership in small metropolitan areas with a population of 100,000-500,000. At this end of the table, small areas seem less hospitable to BIPOC business owners than do middle-sized areas – but not as bad as large areas. The three small areas with the worst BIPOC population: business ownership proportion are all in the top ten overall, and there are 15 small areas among the top 40 underserved communities.
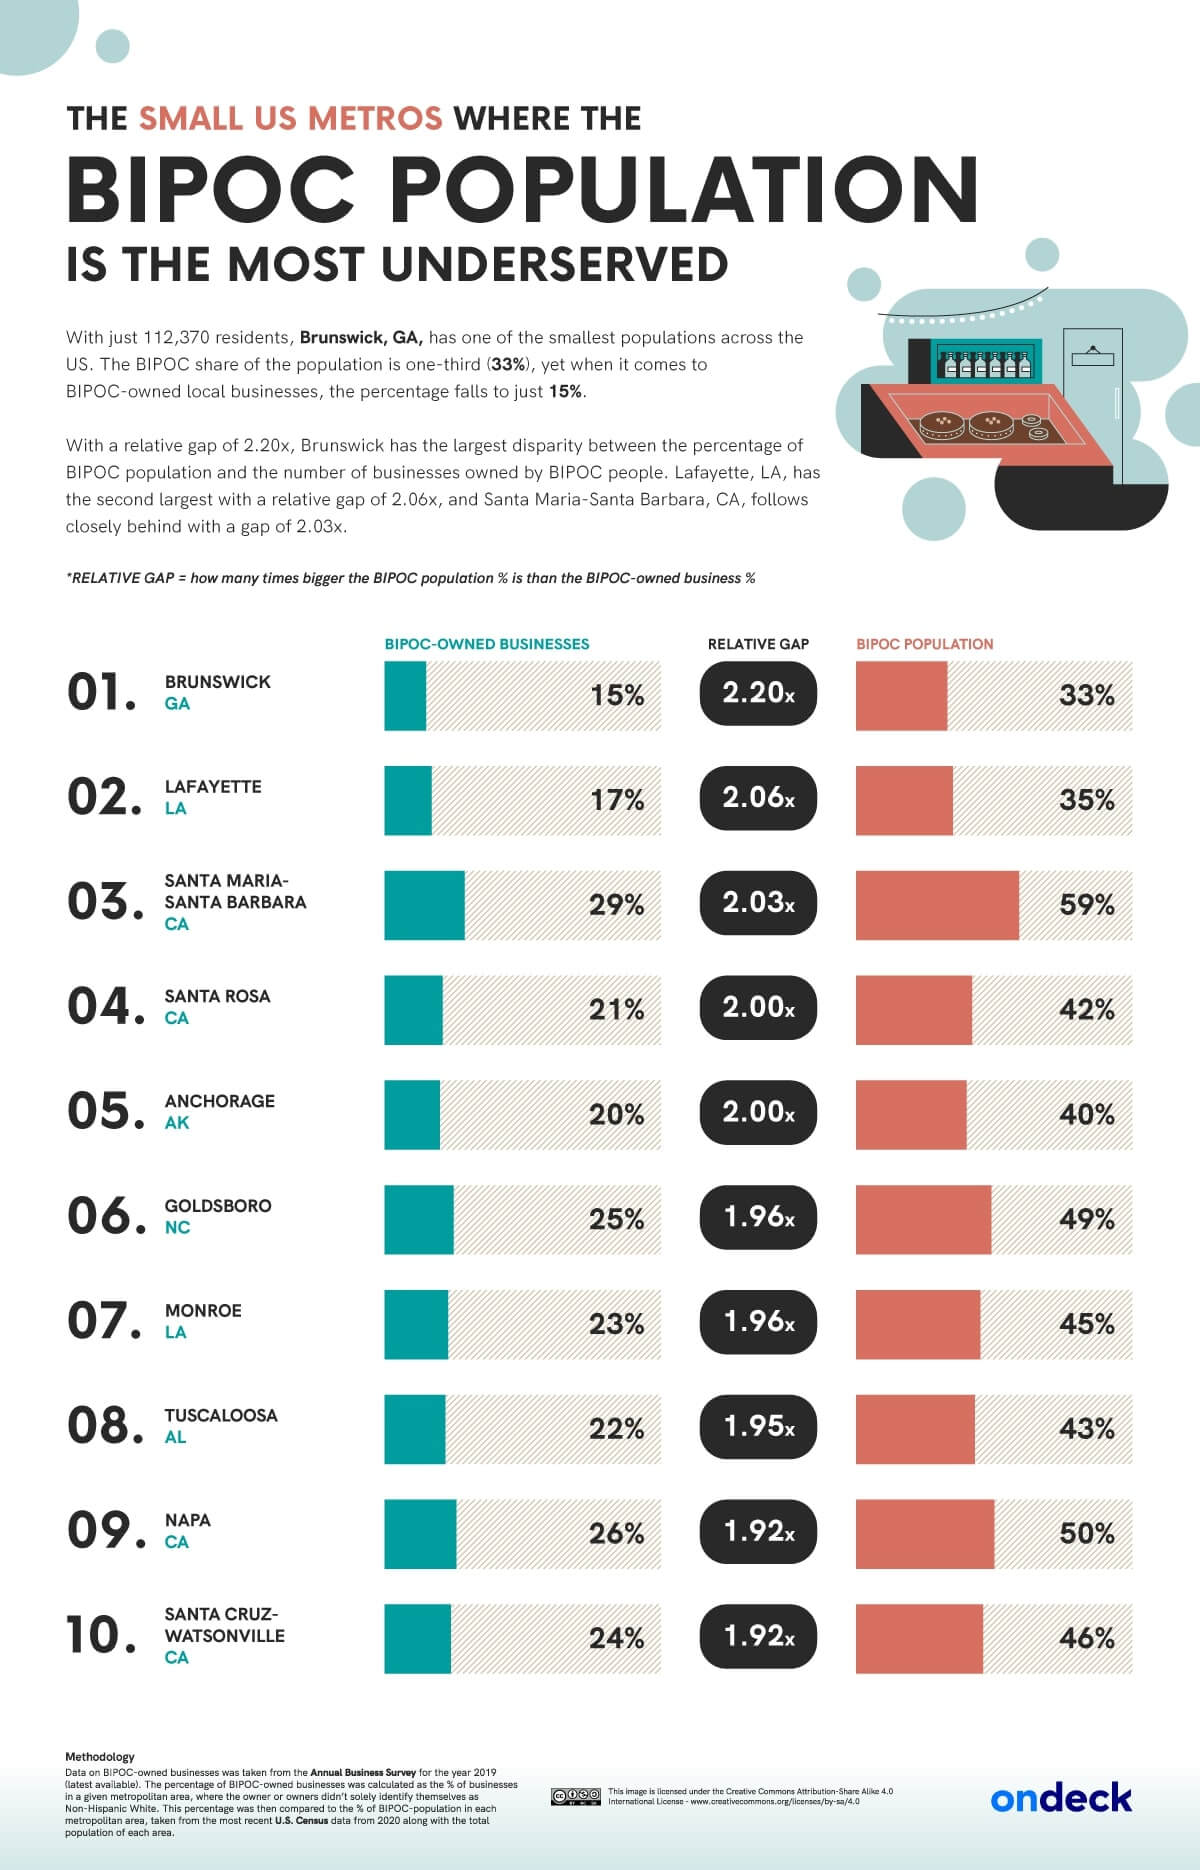
However, we found 41 small metropolitan areas where the percentage of businesses with BIPOC ownership is greater than that of the local BIPOC population. We also found seven small areas with 1:1 parity:
- York-Hanover, PA
- Joplin, MO
- Billings, MT
- Florence-Muscle Shoals, AL
- Watertown-Fort Drum, NY
- Mankato-North Mankato, MN
- Gettysburg, PA
The metropolitan area where BIPOC business ownership most significantly outweighs the local BIPOC population is Kingsport-Bristol-Bristol, TN-VA. BIPOC individuals make up just 8% of the local population but own 21% of local businesses.
BIPOC Business On the Rise
Starting a business is one of the toughest and bravest things a person can do – more so when they lack the privileges of majority groups. But BIPOC business ownership is on the rise. Supporting minority-owned businesses and raising their public profile can help shift the balance of power and provide inspiring examples to young BIPOC entrepreneurs entering a sometimes inhospitable landscape.
Our full research data is available to study in the interactive table below.
METHODOLOGY & SOURCES
Data on BIPOC-owned businesses was taken from the Annual Business Survey for the year 2019 (latest available). The percentage of BIPOC-owned businesses was calculated as the % of all businesses in a given metropolitan area where the owner or owners didn’t solely identify themselves as Non-Hispanic White.
This percentage was then compared to the % of BIPOC-population in each metropolitan area, taken from the most recent U.S. Census data from 2020 along with the total population of each area. Similarly to BIPOC-owned businesses, the % of BIPOC population was calculated as the % of people who don’t identify as Non-Hispanic White.
Relative gap between the % of BIPOC population and % of BIPOC-owned businesses represents how much higher the % of BIPOC-owned businesses should be in order to equal the share of people of color in the population of each area.
Metropolitan areas where the number of businesses by ethnicity and race was suppressed for validity reasons by the U.S. Census Bureau were excluded from the dataset.
Data was collected in October 2021.
Related Articles